

The Hypothesis-Testing Process. I’d never worked for a hospital, so the expertise I was bringing wasn’t hospital management but a problem-solving method that has been proven over centuries – “hypothesis-testing.” I’d been introduced to the process in high school science. I learned how this process could be applied to business in the training “boot camp” I got when I joined a strategy consulting firm (Bain & Company) right after business school. (I teach this methodology to clients around the world today.)
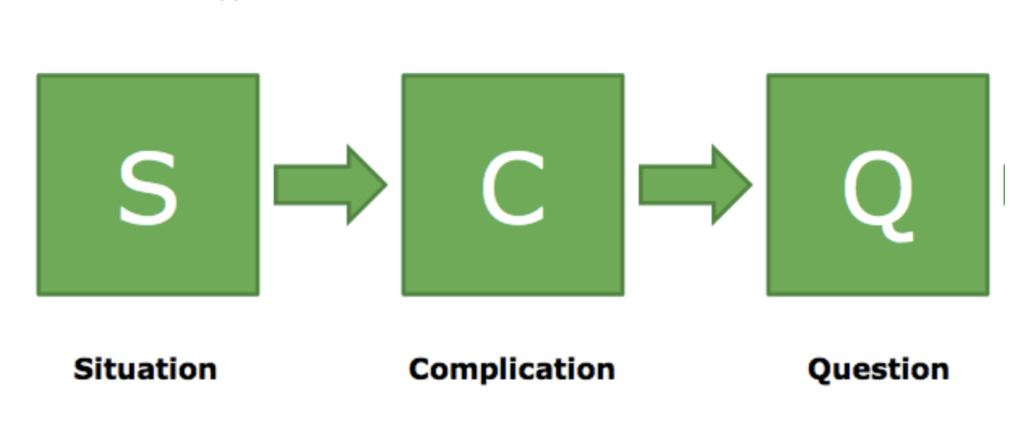
The Problem Statement. I started my hospital case by clarifying with my client the problem I was going to solve. I did this with a simple one-page introduction with three parts.
- Situation: A definition of the client and their normal situation. Example: Hospital X is a government-owned and funded hospital that has been successfully serving patients in the community for decades.
- Complication: A definition of what has changed in their normal situation that is causing a problem. Example: Hospital X’s overtime costs have grown steadily and necessitated several supplemental budget requests from the government. Future budget supplements are unlikely, meaning the Hospital will have to cut costs in other critical areas to cover future unbudgeted overtime.
- Question: A definition of the problem the consultant is being hired to solve that clearly outlines what success would look like. Example: What strategies can Hospital X management successfully and rapidly implement to substantially reduce overtime costs without negatively impacting patient care?
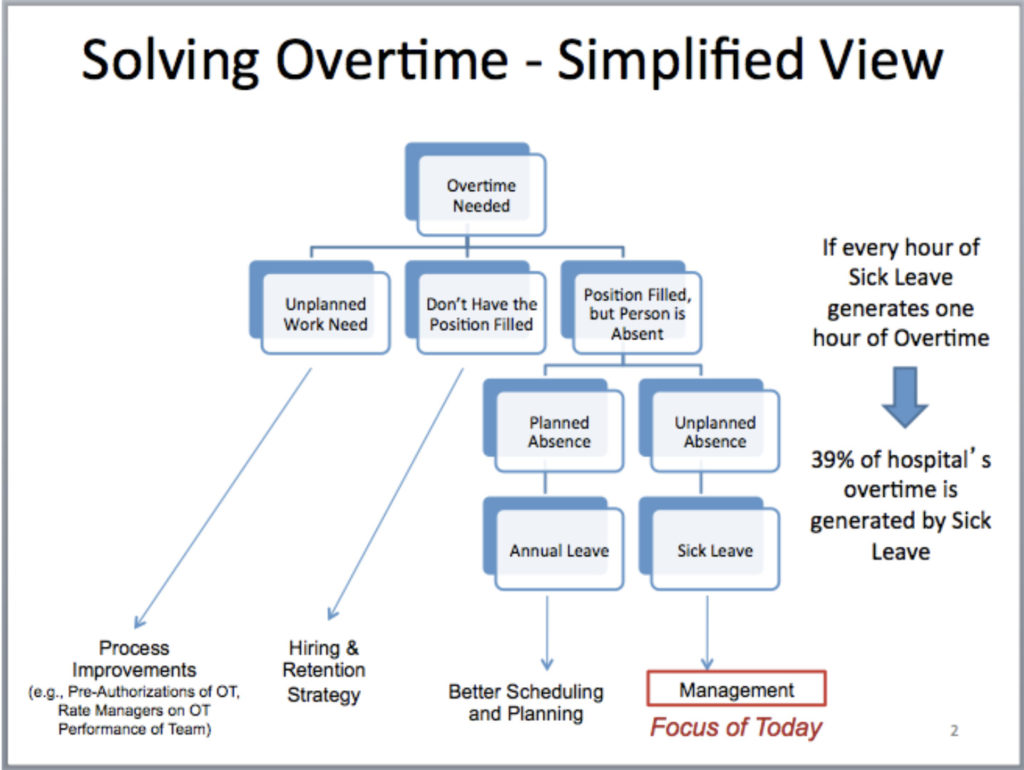
 The Issue Tree. Next, I created a logical framework – an “issue tree” – to identify all the potential root causes of overtime and categorize them into distinct categories. I chose “Supply-Driven” versus “Demand-Driven” at the top of my framework to organize the potential causes. Potential overtime root causes in the “Supply” category would be things related to the supply of labor – e.g., ‘not enough staff.’ Potential causes in the “Demand” category would be drivers of the demand for labor – e.g., ‘number of patients increased.’ For each main category, I then added subcategories where they seemed logical. For example, I split the ‘not enough staff’ potential cause into subcategories of ‘not enough staff assigned’ vs. ‘enough staff assigned but not present.’

The Interview Guide. I translated that logical framework into an interview guide that I could use in the meetings I was to have with the top executives of the hospital. As I walked through the list of all the possible root causes of the overtime problem with each executive, I got a variety of information and opinions on where the biggest, fixable root causes were. After those meetings, I adjusted and added to my logic tree of potential root causes.
Prioritizing Potential Hypotheses. Now that I had a good list of all the hypothetical root causes, I prioritized them based on each’s probability of being the best answer to the problem. This is important because it takes work to get the data and do the analysis to test each hypothesis. To test them all would require an unacceptable amount of time and effort for both me and my client. I was going to test one hypothesis at a time so, hopefully, I would be able to guess which was the ‘winner’ in just one or a few tries. I was able to put the whole ‘Demand’ part of my logic tree at the bottom of the list because of the information I uncovered in the manager interviews. Their patient population was steady and very predictable, so overtime was not being driven by unforeseen surges in demand. The problem had to be related to ‘Supply’ – staffing.
Defining First Hypothesis to Test. Within the ‘Supply” side, I decided to start with an “Excessive sick leave is driving overtime and can be reduced” hypothesis for three main reasons.
- First, staff calling in sick was a very logical source of overtime since those gaps are unplanned and have to get covered at the last minute, and overtime would be the most convenient solution.
- Second, as I looked at the issue through the eyes of workers and not of management, I realized many of them probably viewed overtime not as a problem but as a good thing allowing them to boost their incomes. They had an incentive to get more overtime, and sick leave usage was the only lever I saw that was entirely in the workers’ control.
- Third, when I asked managers for their ideas about the potential root causes, excessive sick leave rarely came up. When I asked specifically about it, it was clear they sensed it was an ‘HR policy issue’ they couldn’t influence.
All together, these reasons, combined with my intuition built by working equally complex problems for many clients across many countries over many years, made me confident I had a strong hypothesis to test.

The Assertion Tree. Now that I had a hypothesis, I had to figure out the things – the “assertions” – that would have to be true for the hypothesis to be true. I settled on three assertions.
- Sick leave is a large driver of overtime.
- The amount of sick leave being incurred is excessive because of abuse of policy.
- Policies and procedures can be implemented quickly to reduce abuses in sick leave usage.
If I could gather the right data, I could test whether these assertions and their overarching hypothesis were true. If the data came back and supported them, I had a winning hypothesis. If the data came back disproving them, I had to find a new hypothesis to test.
The Blank Deck / Storyboard. With a clear top hypothesis to test first, I focused my first data request from the hospital’s IT team clearly on that issue. I sketched out the charts that would show the data in the right format to prove or disprove each assertion, complete with the dates I wanted and the labels of the axes. By mapping out all the charts and slides in a “blank deck” before I had any data, I knew exactly what I needed to get. It would save time, for both me and my client, by avoiding gathering unneeded or “nice to have” data.
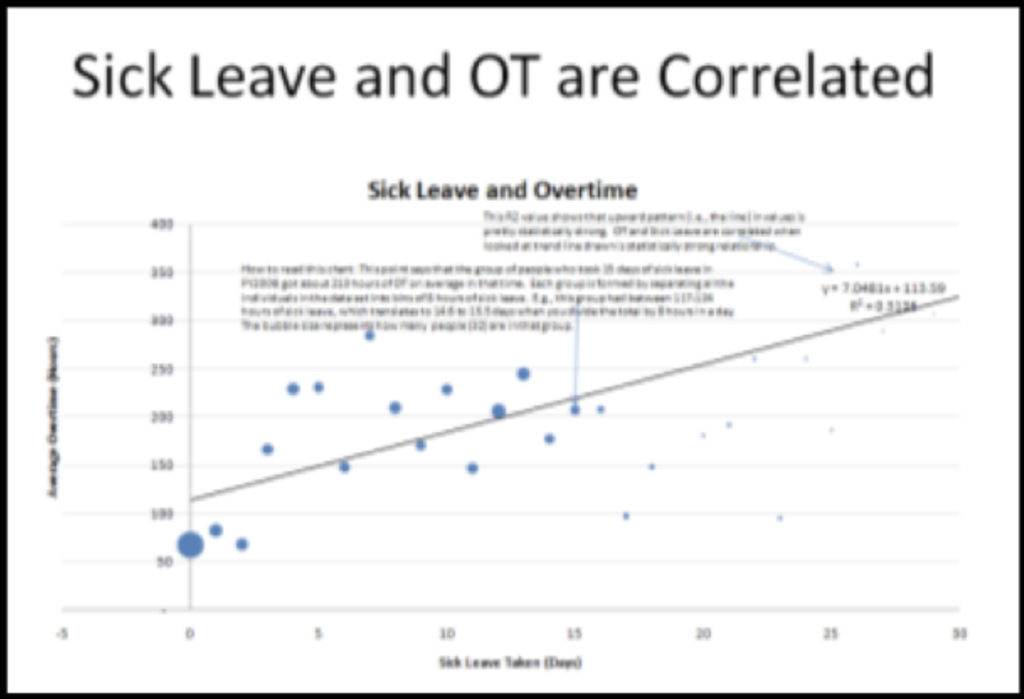
The Analysis. The raw data came back quickly and I analyzed it using Tableau software. As soon as Tableau rendered the first charts, I knew we had cracked the case with our first hypothesis. Specifically, here is what the data proved:
- There was a strong correlation between sick leave and overtime on an overall level. When hospital-wide sick leave was high or low in a pay period, so was overtime.
- The majority of sick leave came from a small group of staff members. This small group of heavy sick leave users used much more sick leave than their peers.
- The majority of overtime also came from a small group of staff members. This small group of heavy overtime earners bumped up their annual salary by 50-150% through overtime.
- There was a significant overlap between the small group of staff who were above average sick leave users and the small group that were above average overtime earners. This small group of people were working excess hours of overtime and taking excess sick leave, even in the same pay period.

Sharing Answer with Client. Once I had all my charts filled in and inserted in a PowerPoint slide deck, I showed my findings to the hospital CEO and his top deputies. They quickly understood the point. When I shuffled through charts of individuals getting overtime and sick leave in the same pay period, they quickly understood the potential. The head of HR responded by saying this practice was not only against their HR policy, but also explicitly banned in their agreement with the labor union. In other words, this solution should be quick and easy to implement. They just needed to convince their line managers to enforce existing policy.

Helping Client Implement. The CEO asked me to help him create the urgency in the line managers by presenting it to them at their next all-managers meeting. For that meeting, I didn’t change the slides, but I thought carefully about how I would present them. The CEO introduced me at that meeting by describing the urgency of the rampant overtime problem and how he had brought me in to help. Before I flipped a single slide on the screen, I walked around the auditorium and asked the dozens of front line managers what they thought the answer was. As each new idea came up, I wrote it down on a white board and thanked them. When the new ideas petered out, I said the following: “What if I told you that the answer is not any of these and is completely in your control?” I got skeptical but curious looks back. When I presented the findings, I made sure I flipped through every individual chart showing the people who took sick leave in the same pay period they earned overtime. I blanked out the private information but left enough publicly-available information in so these managers would know which staffers were on their team.
Being a Change Agent. I was being provocative and theatrical on purpose because figuring out the answers to tough problems is only half the job of a strategy consultant. The other half is doing whatever you can to empower your client to implement the answer. In this case, I figured the best way I could do that was to be a provocative change agent and directly challenge the front line managers with real examples of them not following policy (albeit not in a personal way). I wanted these skeptical managers to debate me on this solution because I had all the facts on my side. And with me in front driving the charge as the “bad cop,” the CEO was able to hang back and focus on finding the best way he could be the “good cop” to lead the implementation process after I left.
Following Up. That meeting was the last day I was formally involved in that project, but I did arrange to get a feed of updates every bi-weekly pay period on their overtime expense so I could track it. Sharing those data also gave me a chance to keep the CEO informed of progress and elicit any questions that may have arisen after I left.
The Result. The pay periods immediately after my presentation showed overtime reduced by 46%, or about $3 million a year, from their steady pattern the year before. When I looked back and added up the hours I spent on this project, I estimated it took me about 80 hours of my time.

To learn more about the training we offer in this problem-solving methodology, visit our Training page or contact us.